In the Buckley Lab’s latest publication “Stand-alone segmentation of blood flow pulsatility measured with diffuse correlation spectroscopy,” Srinidhi Bharadwaj and Tara Urner et al. present a signal processing method for isolating blood flow pulses from noisy diffuse correlation spectroscopy (DCS) signals. Importantly, this method does not require the use of an exogenous reference signal – such as from a blood pressure or electrocardiography machine – to identify pulse onsets, which has been the standard approach. When compared to blood pressure-based pulse segmentation in a cohort of 30 subjects, the stand-alone method performed comparably, demonstrating the wide applicability of the technique. Removing the need for an exogenous reference signal will allow broader application of promising pulse analysis techniques to DCS-derived blood flow waveforms, which show promise as biomarkers of cerebrovascular health. MATLAB code implementing the method is available from the Buckley Lab’s public Github page.
 |
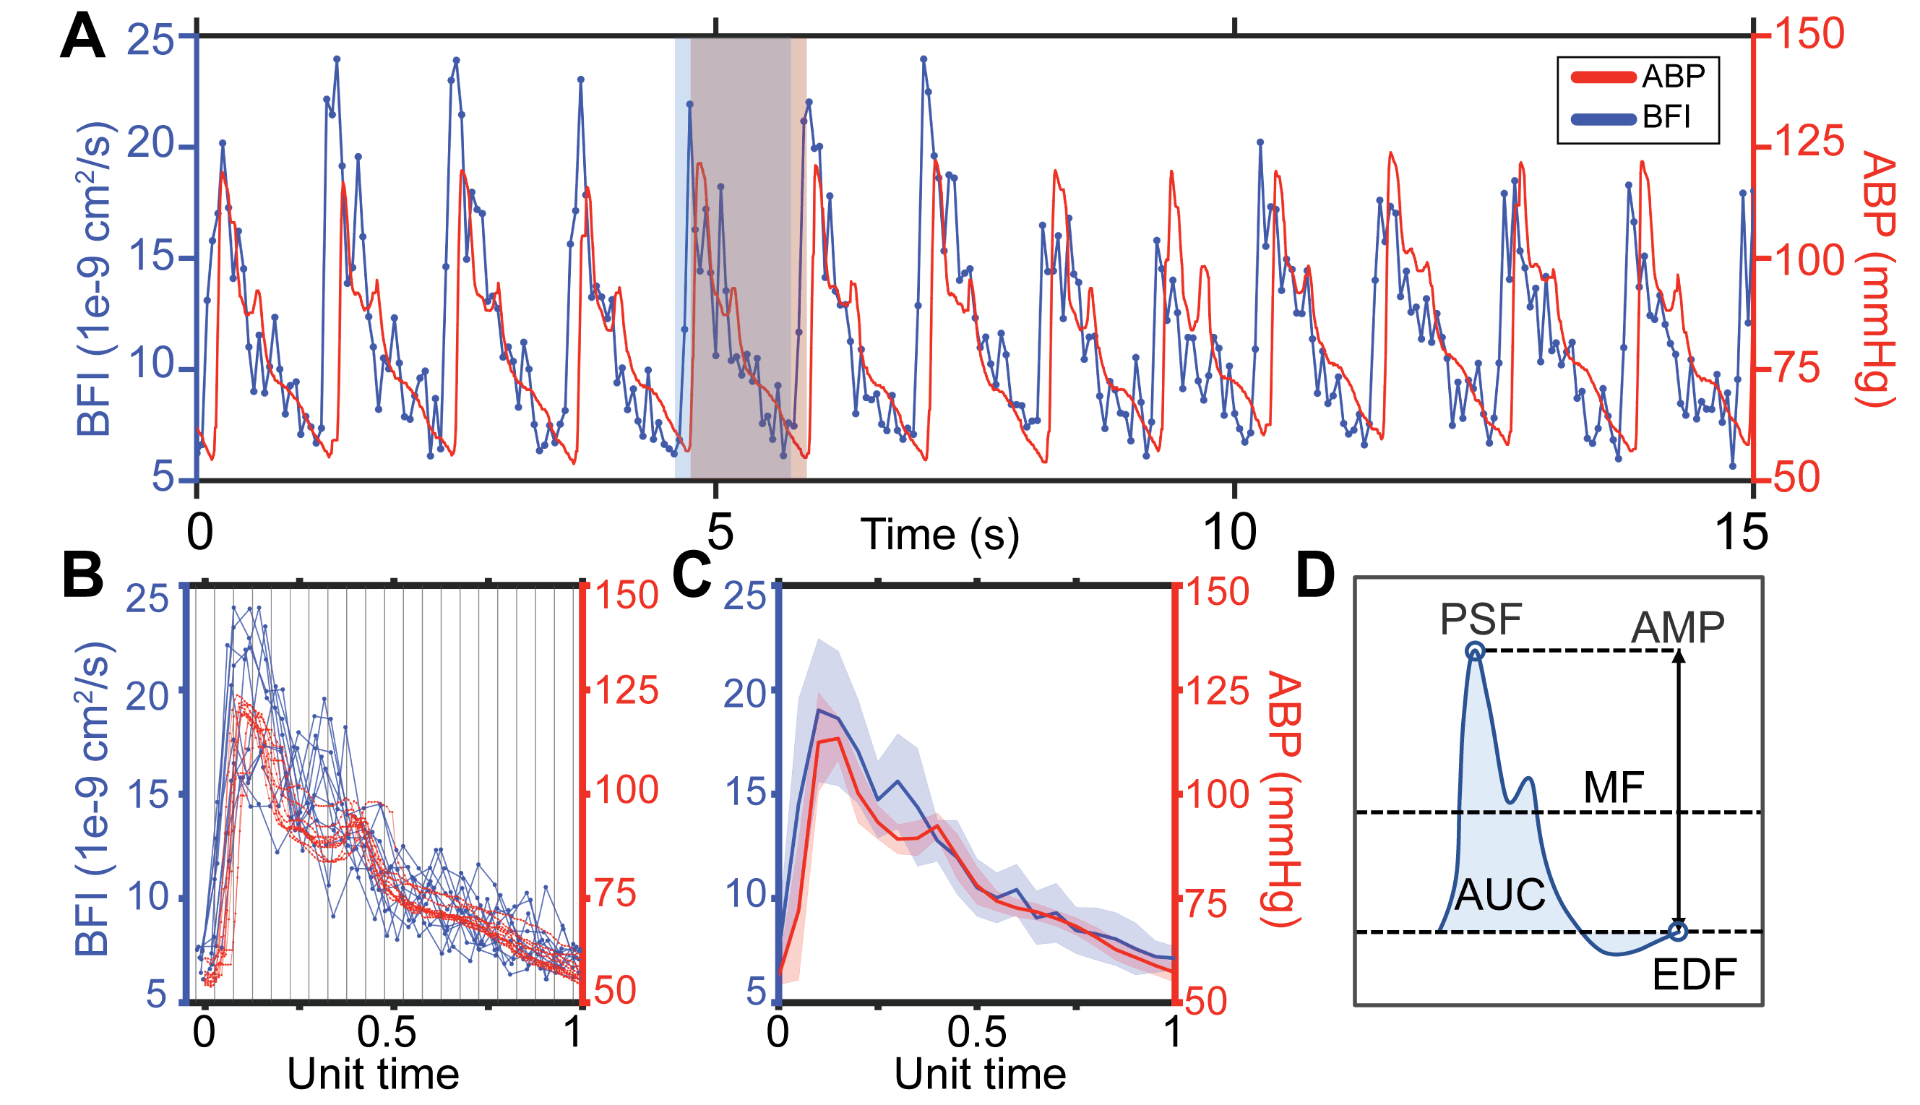
Comparison of BFI segmentation with stand-alone vs. reference-based method. A. Representative DCS-derived blood flow signal (blue), filtered waveform used for stand-alone segmentation (green), and time aligned arterial blood pressure (ABP) signals (red). Dashed vertical lines in green and red represent onsets identified from the filtered signal and ABP, respectively. B. Overlaid pulses from the window in A, normalized to unit length. Green denotes individual pulses segmented with the stand-alone method and red denotes pulses segmented using ABP. Vertical lines denote 20 equally sized bins used for averaging. C. Resulting mean (stdev) BFI waveforms obtained using the filtered DCS signal or ABP as a reference signal. D. Schematic depiction of pulse morphology features quantified. Abbreviations: mean flow (MF), peak systolic flow (PSF), end diastolic flow (EDF), amplitude (AMP), and area under the curve (AUC). |