In our latest work published in Biomedical Optics Express, Tara Urner et al. present quantification of the average morphology of cardiac waveforms in the cerebral blood flow signal measured with diffuse correlation spectroscopy (DCS), and how these waveforms behave in response to vasomotor changes. Pulse waveform analysis has long been used with the current state-of-the-art technique for capturing macrovascular blood flow – transcranial doppler ultrasound (TCD) – but cardiac pulsatility at the microvascular level in the brain has only recently become accessible at the bedside using DCS. Several groups have taken initial steps towards applying waveform analysis to DCS-derived blood flow for clinical applications, but knowledge of what “normal” waveforms should look like has been lacking. This work aims to lay the groundwork for future clinical applications of DCS combined with waveform analysis by presenting typical resting-state values for a variety of morphological features as well as quantify waveform response to a vasoactive stimulus. The authors found that the blood flow waveform exhibited marked changes with vasodilation including increasing pulse amplitude and area under the curve. Additionally, significant sex-based difference were observed in the waveform, consistent with previous findings with TCD. These exciting results set the stage for DCS-derived blood flow waveform morphology to provide much-needed noninvasive biomarkers of cerebrovascular health and disease.
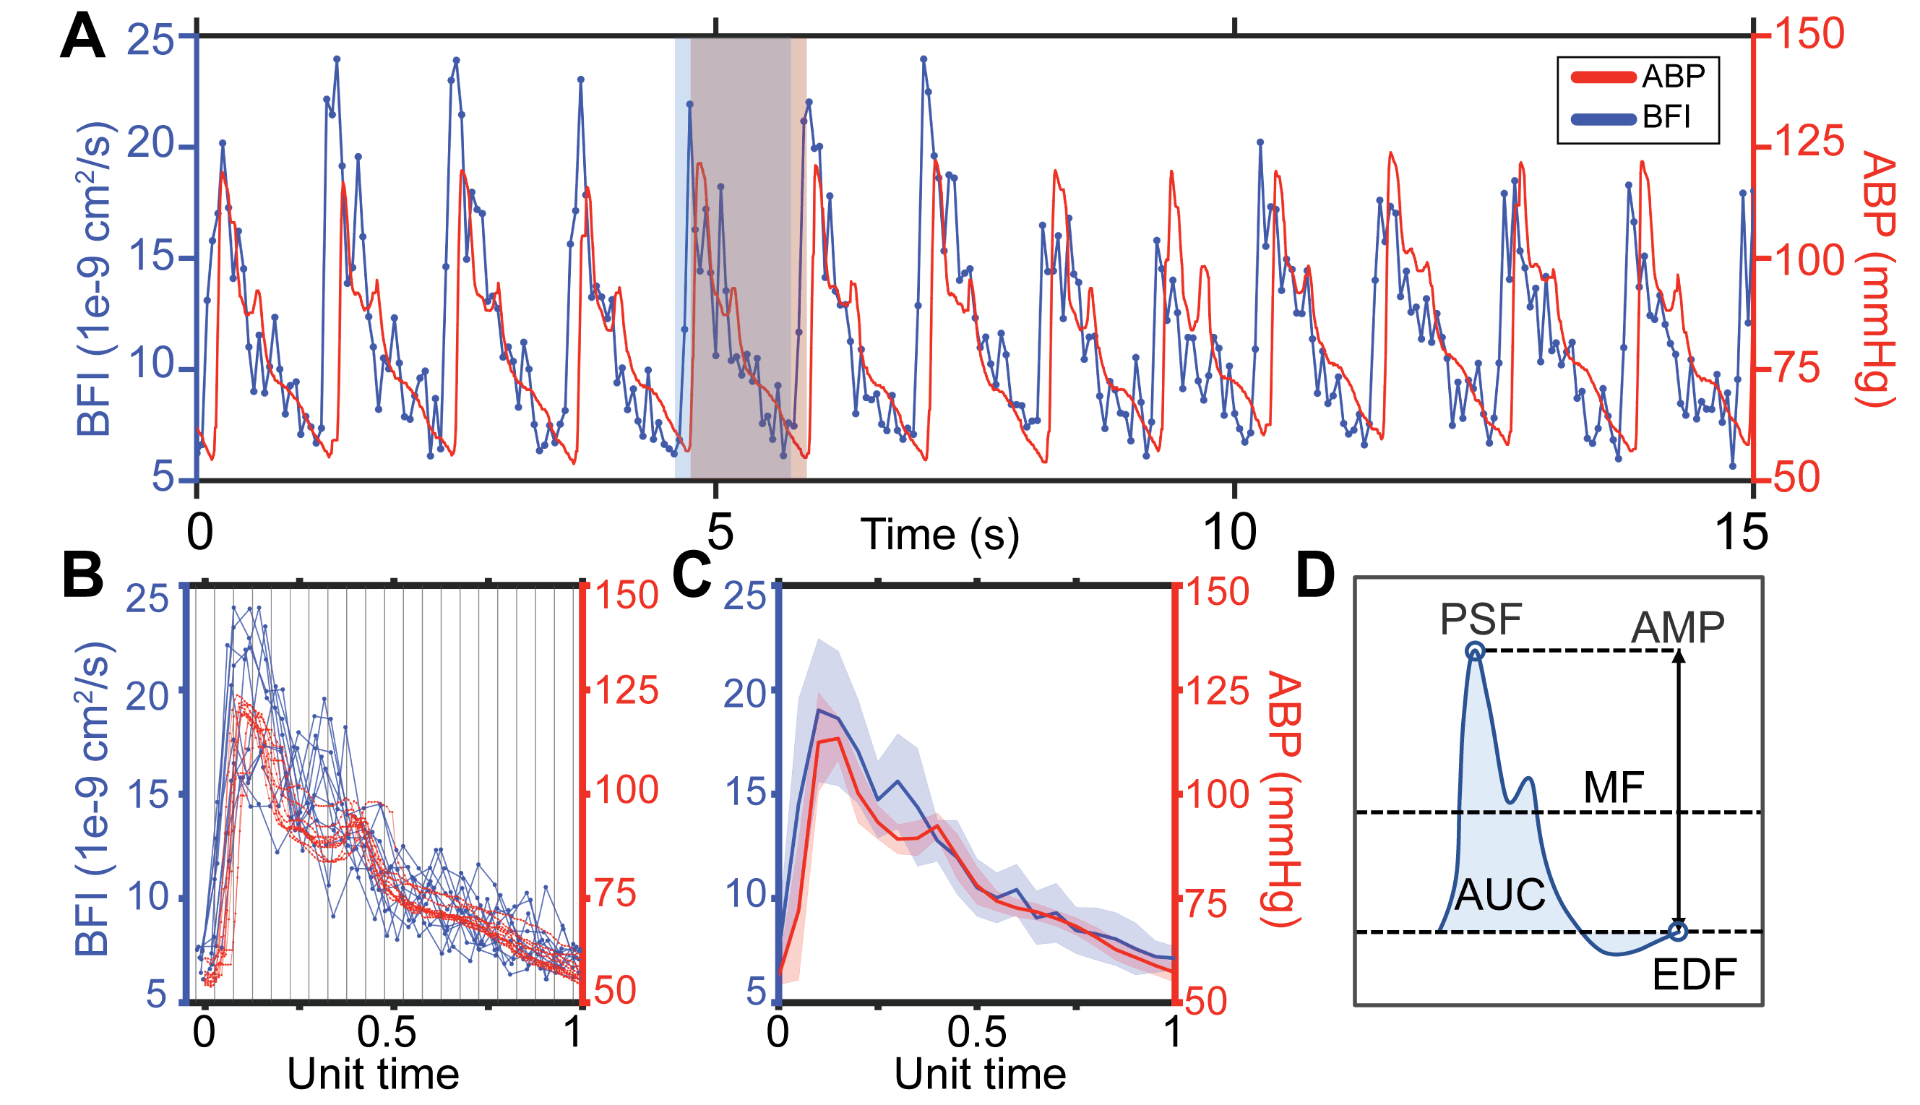
Fig. 1. Estimating microvascular blood flow waveforms. (A) Representative 15s window of pulsatile blood flow index (BFI, blue) and arterial blood pressure (ABP, red) signals. The flow waveform leads pressure. The red shaded box shows the boundaries of an ABP pulse, while the blue box denotes the boundaries of the corresponding BFI pulse. (B) Waveforms extracted from the 15s window are overlayed, preserving the sampling offset between ABP and BFI. Each pulse pair is normalized by the same factor such that ABP pulse length is set to a unit length of 1, then binned and averaged. (C) Final average blood flow and pressure waveforms over the 15s time window, shading shows standard deviation. (D) Schematic diagram of morphological features directly quantified from each pulse: mean flow (MF), peak systolic flow (PSF), end diastolic flow (EDF), amplitude (AMP) and area under the curve (AUC).